Data visualization tools


Unlock the power of data with cutting-edge visualization tools. From transforming complex datasets into clear insights, immersive charts and graphs empower informed decisions, driving business success. Experience data visualization redefined


Metabase Logo
Plotly Logo
seaborn logo
jupyter logo
tableau
power-bi
excel
googlesheets
ESRI_Logo
qgis_Logo
d3js

About Geospatial BI


GeoBi provides comprehensive insights into market conditions and organizational performance across diverse business regions. Leveraging geospatial analytics, we harness data from GPS, location sensors, social media, mobile devices, and satellite imagery to create visualizations that uncover trends and relationships between people and places.

Geospatial Intelligence Cookbook


Technology Used: Python / Google API / QGIS / IBM SPSS


Geospatial Business Intelligence Github Wiki


Geo-intelligence is a strategic combination of the application of geographic information systems (GIS) and business intelligence (BI) to manage data and get valuable insights.

Independent Samples t Test - Distance and Consuming Behavior simonrenauld's T_test

See More

Web Mapping


Technology Used: Leaflet/javascript/d3js/crossfilter/bower/HTML Data Table


Web Mapping Github Wiki


Web mapping is the process of designing, implementing, generating and delivering maps on the World Wide Web. It enables us to easily geo-analyze our contextual business data and KPI on dynamic maps.

simonrenauld's dashboard

See More

Geomarketing


Technology Used: ArcGIS/ArcGIS Network Analyst/IBM SPSS/SQL


M.Sc. Thesis Geo-marketing


Analysis of Current and Potential Customers for The Société des établissements de plein air du Québec (SEPAQ)


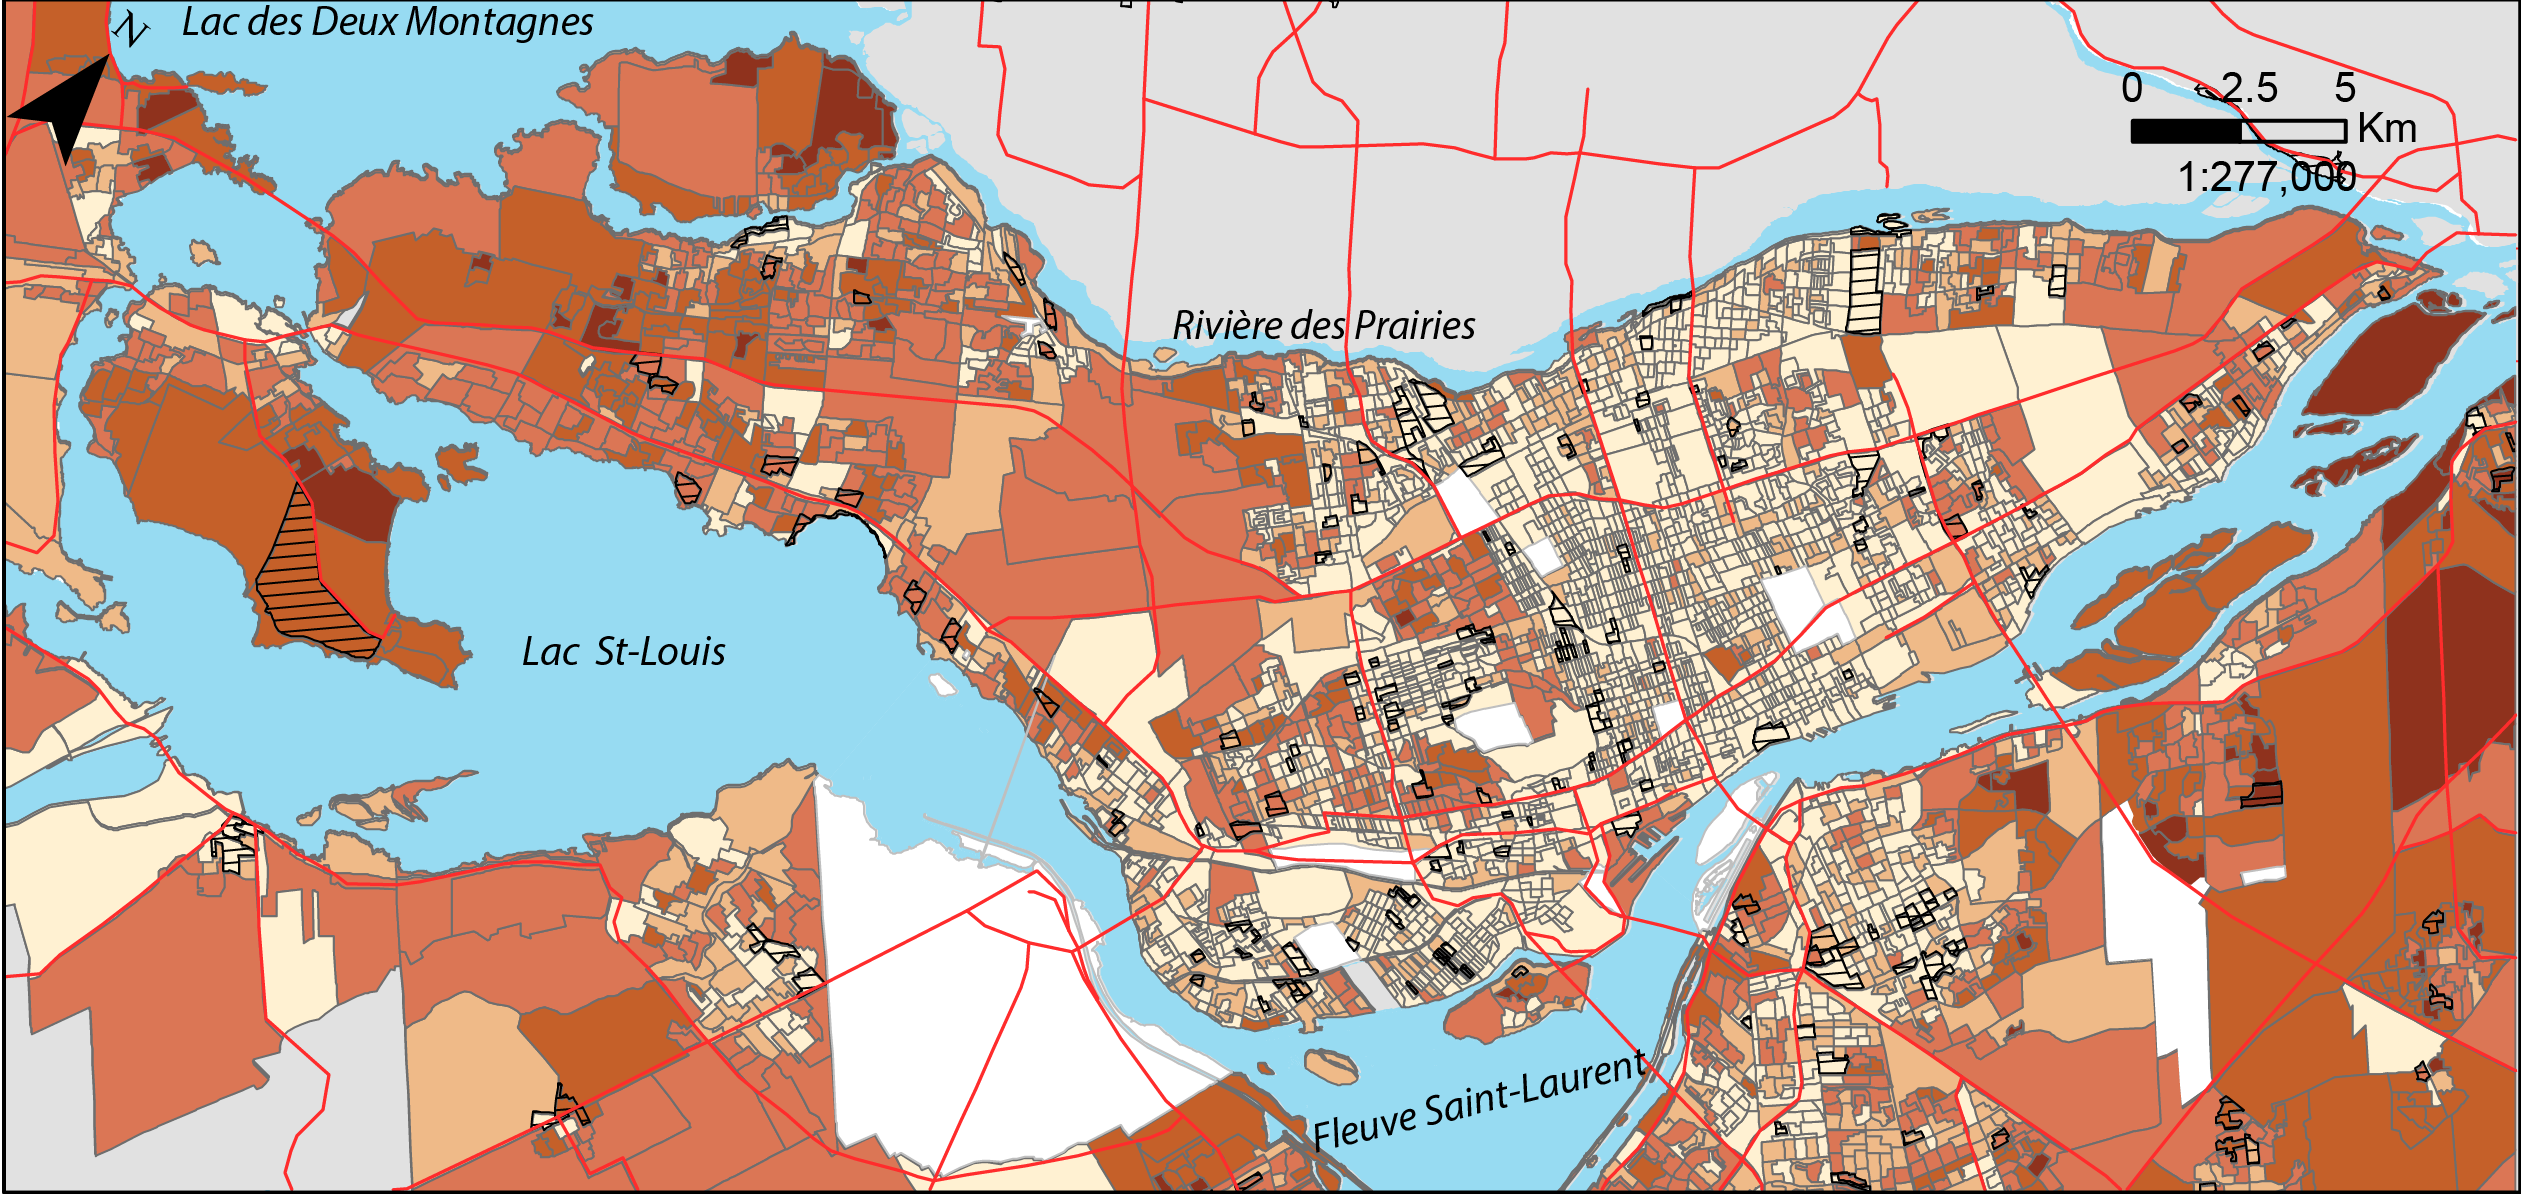
Abstract: Geomarketing is a discipline located between geography, geomatics and marketing. The potential offered by the use of GIS and geospatial data, allows us to get unique insights for strategic marketing decision making.

simonrenauld's Github chart

SÉPAQ Website

See More